Overview
This aim of this app is to generate reasonably configurable
low-polygon parametric trees for use with BIM and building performance analysis.
To be used effectively in any detailed analysis, tree geometry needs to be as simple
and light-weight as possible, but still sufficiently configurable to reasonably
represent the size, shape and shading effects of existing or future trees on a site.
Also, the leaf canopy needs to be able to vary its colour and opacity across the year
to properly represent the dynamic seasonal effects of deciduous trees that shed and
then regrow their leaves annually.
Unfortunately there are very few tools available that can viably
model or describe these dynamic seasonal shading effects, which in turn means that most
building analysis software either ignore it or provide only limited means to deal with it.
Thus, the hope is that having tools that make modelling and describing it relatively
simple and straightforward may motivate more analysis tools to better support the
dynamic shading effects of vegetation.
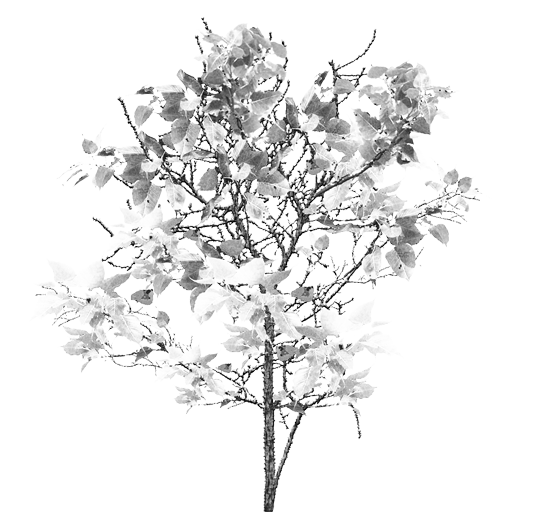
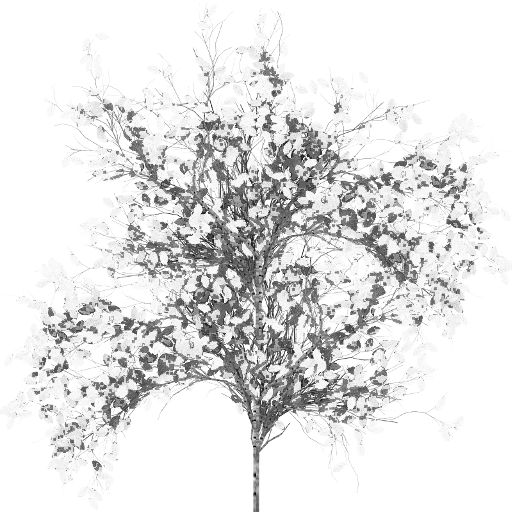
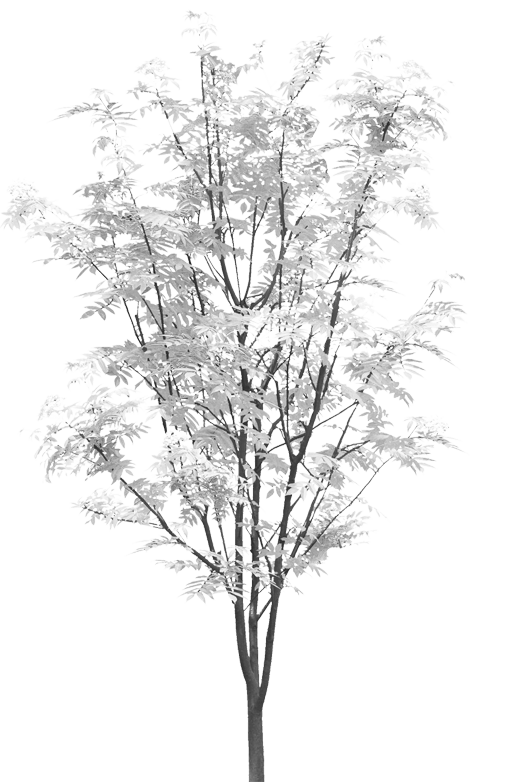
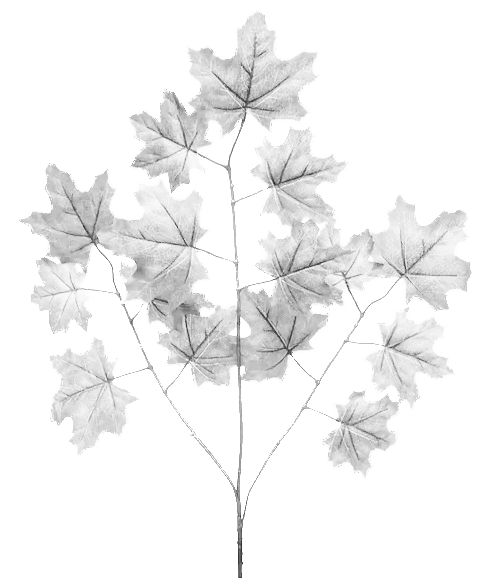
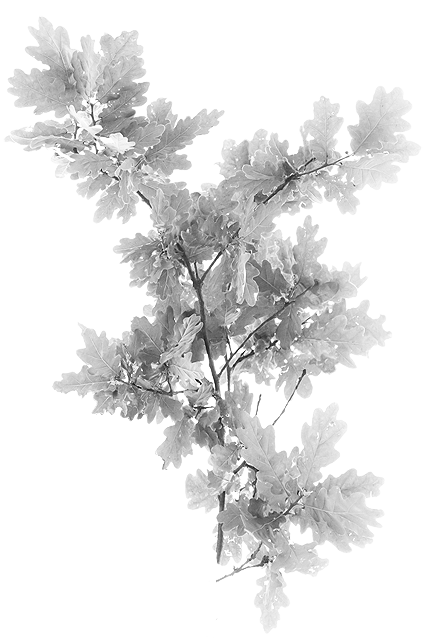
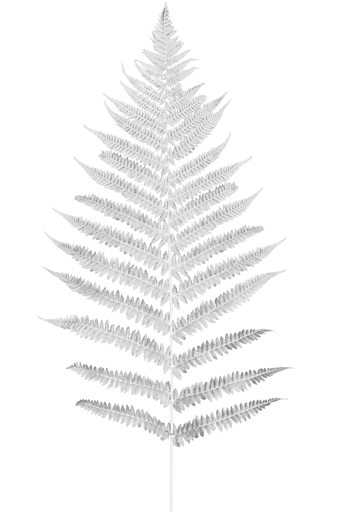
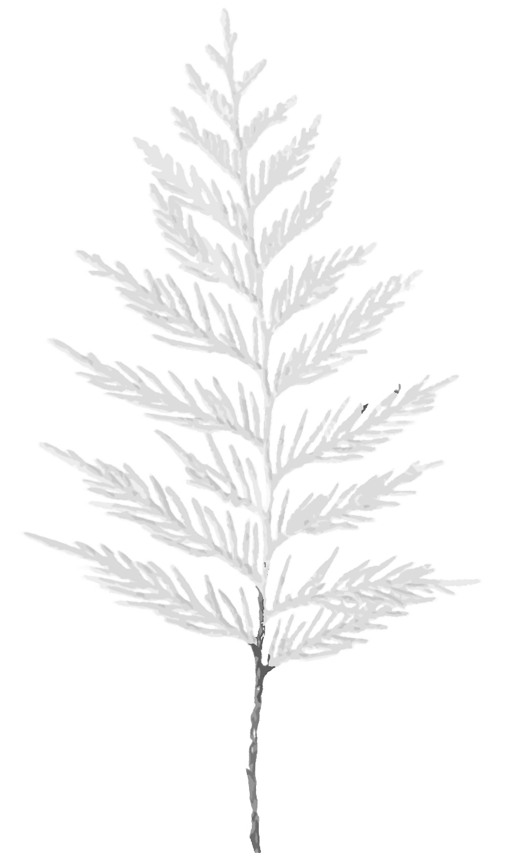
The app can generate both simple abstract geometric representations
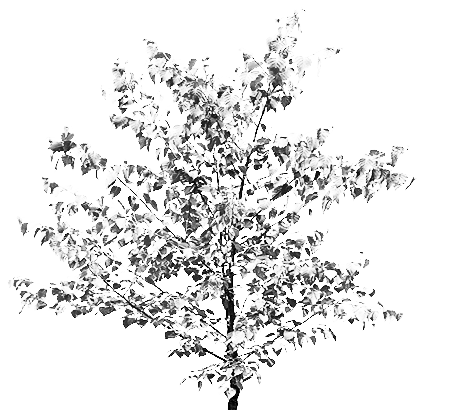
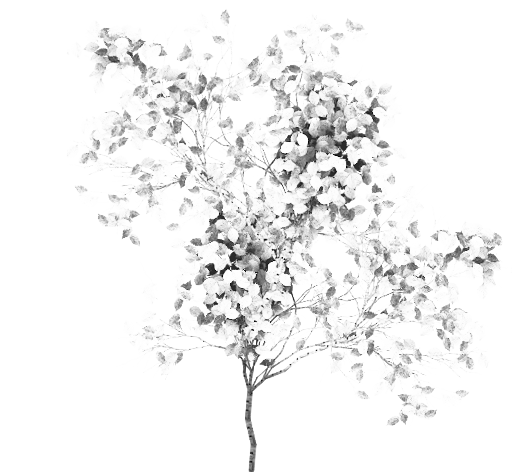
as well as much more realistic trees that use mapped textures to model the foliage (thanks
to proctree.js - see Credits).
Each procedural generator requires a fair number of controls for the various parameters that
govern the results, so simple experimentation is the only real way to gain an understanding
of what each one does. However, it is probably worth explaining some apsects of the
geometric representation.
Geometric Representation
There are a number of ways you can generate natural-looking geometric
canopy shapes. One is to use some standard polyhedon and subdivide their surfaces into
triangular leaves. Another is to distribute random, semi-random and ordered points over a
sphere and then connect those points into facets to form a surface. Alternatively, you can
also use various spatial algorithms to calculate values in the cells of a 3D volumetric
data grid and then generate the canopy as an iso-surface.
The most obvious way to create a surface from random points in
space is to simply join them all together with triangles, which is exactly what the
Delaunay Triangulation method does. Another way is to generate
Voronoi Cells by joining the centers of each adjacent triangle to
create more complex polygonal facets. A further method is to generate a Convex Hull
from the points, which is essentially just wrapping them in a stretchy fabric such that
only the outer-most points define the shape. On the other hand, an iso-surface shows the
bounding volume for a given threshold within a spatially varying value.
- Polyhedra
Generates a range of polyhedra based on Platonic and Archimedean Solids, and then
subdivides their surfaces into triangular leaves. As the subdivision is recursive, the
total number of leaves can quickly blow out so the subdivisions are dynamically limited
by face size and number. This means that the leaf count is stepped incrementally, so
you may need to change the Leaf Count value a lot to see any changes.
- Fully Random
Generates a completely random set of azimuth and altitude values, except for
the first five points which are distributed pseudo-randomly to form a basic octahedron
between base and apex to ensure a reasonable shape even with only a very small number
of points. This is controlled by the Leaf Count value.
- Pseudo-Random
Divides the sphere into roughly equal-area patches based on the Leaf Count or
Azimuth/Altitude Band values, and then randomly locates a point within each patch.
- Fibonacci Lattice
This uses a Fibonacci spiral or lattice to distribute points from the apex down
over the surface of a sphere. This is a surprisingly simple method, but seems to
give the best approximation of equal-area subdivision than any other method
I have found, and accurately represents the Leaf Count.
- Geodesic Subdivision
Divides the sphere into eight spherical triangles, then iteratively subdivides
each triangle based on the square root of the Leaf Count or the given Geodesic
Segmentation value. Geodesic subdivision occurs in incremental steps, so you may need
to change the Leaf Count value a lot to see any changes.
- Perlin Noise
Generates a 3D volumetric grid based on the current canopy radius and height,
and then uses a Perlin noise function to generate values in each cell. The
canopy is then creating by determining the iso-surface at an appropriate
threshold value. The resolution of the 3D grid is determined from the Leaf
Count or Azimuth/Altitude Band values.
- Metaballs
Generates a 3D volumetric grid around a series of spherical 'clusters' of leaves
within the canopy. Each spherical cluster, or metaball, represents a field of influence
and the value at each grid cell is derived from the sum of all the influences within range.
When two or more spherical fields are sufficiently close to each other, their field
strengths combine in interesting ways. The resulting canopy is then created by
determining the iso-surface at an appropriate field strength threshold value.
The resolution of the 3D grid is determined from the Leaf Count or Azimuth/Altitude
Band values.
Background
I started out looking only at abstract geometric representations
of tree geometry, but then discovered Paul Brunt's excellent proctree.js
code, which generates much more realistic tree trunks and uses texture mapping for foliage.
After implementing and exploring that for a while, and adding radial branching as well
as forking and my own textures, I now think that there are applications for both styles
of tree.
There are other tree generators out there, but they tend to focus
more on realistic visualisation, texturing and rendering. There are not many tools that
I could find for generating simple abstract geometry-only trees, other than more generic
mesh editors which you can bend to that purpose. Also, I wanted to be able to deeply
integrate parametric trees directly in my BIM tools as being able to accurately model
site conditions goes a long way towards making an analysis model believable.
Thus, I really needed to write my own in order to strike the right
balance between something that looks convincingly like a tree but is still simple to
model and manipulate, and that matches the visual style of my building model editor.
Interesting Features
The following are some of this app's more interesting features:
- You can use the Bushiness value to deconstruct
the generated surface geometry into randomly perturbed facets that better visually
simulate tree foliage,
- To get a better feel for the size and scale of your tree, you
can display a human form next to it by toggling the Human Scale
button in the bottom left of the window. You can also choose to toggle external
dimension lines in the same way,
- When generating trees using metaballs, you can interactively
click on any of the balls within the 3D model to select and dynamically edit them,
- Making the volumetric iso-surface generation used in the
Perlin noise and metaballs methods fast enough to support dynamic interactive
manipulation was a pretty interesting challenge. Also, I chose to use Surface Nets
instead of Marching Cubes for calculating the iso-surface as the resulting quads
just look so much better than typical surface triangulation,
- The use of Perlin noise to generate tree geometry has lots of
potential, so it's worth spending a little time experimenting with different radial
and spatial variations values,
- I almost didn't include the Convex Hull method in the final tool
as it seemed more suitable for rocks and stones that tree canopies. However, it does
look pretty good when you use a high leaf density, high lumpiness and low spikeyness
as it create large facets with soft edges.
© Dr. Andrew J. Marsh, 2019.
View Manipulation
You can interactively adjust the 3D view of the model using a mouse,
pen or stylus, or by touch on a tablet or phone.
You can also use the items in the 3D View Settings popup.
- Rotation:
- Drag with the left/right button or a single finger,
or use the arrow keys.
- Panning:
- Drag with the middle button or two/three fingers,
or use the A and D keys.
- Zooming:
- Use the scroll wheel or pinch with two fingers,
or use the W and S keys.
NOTE: You can use the Shift and Ctrl/Meta keys to adjust the increment
of each scroll event or key press.
Keyboard Modifiers
The Shift and Ctrl/Meta keys are used pretty extensively
to modify interactive data entry. This applies to all increment buttons, scroll wheel motion,
slider controls and input elements.
- Shift Key:
- Increases input to larger values, usually by ten times or significantly larger increments
such as 1 month for dates and 1 hour for times.
- Ctrl or Meta Key:
- Decreases input to smaller values, usually by one tenth or the smallest reasonable increment
such as 1 day for dates or 1 minute for times.
NOTE: You can use the scroll wheel to edit a data value when hovering over any slider,
numeric input or even table rows that indicate their editibility.
Credits
This page uses the following frameworks/components:
Bootstrap v3.3.2
Copyright © 2011-2015 Twitter, Inc. - github.com/twbs,
http://getbootstrap.com/
(LICENSE)
Bootstrap-popover-x v1.4.0
Copyright © 2014, Kartik Visweswaran, Krajee.com,
https://github.com/kartik-v/bootstrap-popover-x
(LICENSE)
Isosurface Polygonizer v1.0.0
Copyright © 2013 Mikola Lysenko - github.com/mikolalysenko,
https://github.com/mikolalysenko/isosurface
(LICENSE)
jQuery v1.11.2
Copyright © jQuery Foundation and other contributors,
https://jquery.com/
(LICENSE)
JSON Editor
Copyright © 2015 Jos de Jong - github.com/josdejong
https://github.com/josdejong/jsoneditor
(LICENSE)
JSURL
Copyright © 2011 Bruno Jouhier - github.com/Sage
https://github.com/Sage/jsurl
(LICENSE)
KnockoutJS v3.2.0
Copyright © Steven Sanderson and the Knockout.js team,
http://knockoutjs.com/
(LICENSE)
Knockstrap v1.2.0
Copyright © 2013 Artem Stepanyuk - github.com/faulknercs,
http://faulknercs.github.io/Knockstrap
(LICENSE)
Leaflet Maps API v1.4.0
Copyright © Cloudmade, Vladimir Agafonkin - github.com/Leaflet,
https://leafletjs.com/
(LICENSE)
Mapbox Delaunator v4.0.1
Copyright © Mapbox - github.com/mapbox,
https://mapbox.github.io/delaunator
(LICENSE)
OpenStreetMap Map Data
Copyright © OpenStreetMap contributors - openstreetmap.org,
https://www.openstreetmap.org/about
(LICENSE)
proctree.js
Copyright © 2012, Paul Brunt - github.com/supereggbert,
https://github.com/supereggbert/proctree.js
(LICENSE)
SnackbarJS
Copyright © 2014 Federico Zivolo - github.com/FezVrasta
http://fezvrasta.github.io/snackbarjs
(LICENSE)
 Loading - please wait...

